1. What tissues does HeBAtlas contain?
HeBAtlas is the first rubber tree proteome database and covers the most comprehensive range of tissues. Including 25 tissues, which are Bark(BAR), B-rubber particle(BRP), Cambium(CAM), Chloroplast(CHL), Cotyledon(COT), C-serum(CSE), Embryonal axis(EMA), Flower(FLO), Fruit(FRU), Lateral root(LAR), Large rubber particle(LRP), Lutoid(LUT), Mature leaf(MAL), Petiole(PET), Plumule(PLU), Radicle(RAD), Rubber particle(RUP), Seed coat(SEC), Small rubber particle(SRP), Stem(STE), Taproot(TAP), Total latex(TOL), Wood(WOO), Wash Solution of Rubber particle(WSR), Young leaf(YOL).
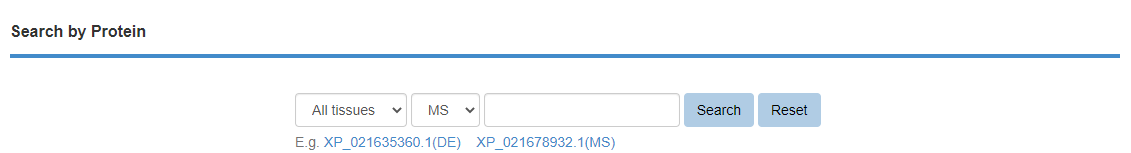
2.How does search for details of individual proteins?
we provide a query approache by protein ID. The user can enter a protein ID in the search box, after selecting clicking the 'Search' button, the search engine will run and return the queried results containing detailed information showing the queried protein, and quantitative results. If users click the 'Reset' button, all current search terms will be deleted.
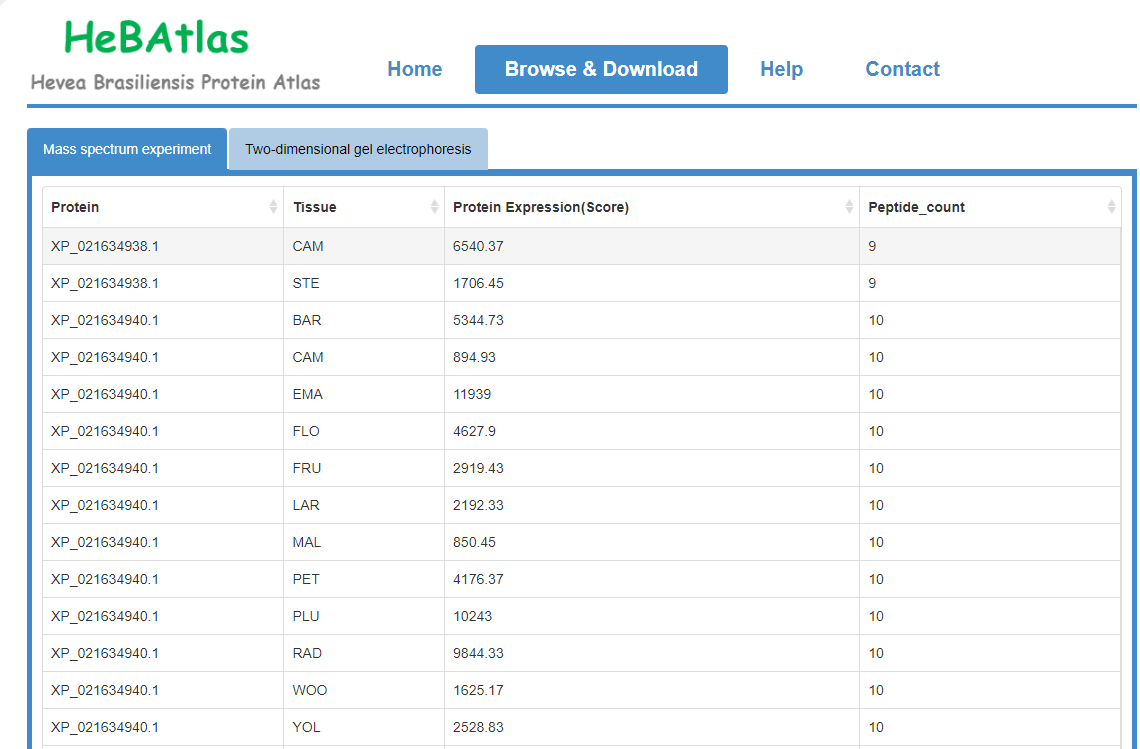
3. How to browse and download the data of HeBAtlas?
The "Browse and Download" page shows information on the location of the rubber tree proteins in the 2DE, and the link shows the mass spectrometry search results. High-resolution mass spectrometry shows quantitative information for each protein in the tissue. It is also possible to directly download images of each gel map, as well as quantitative results and qualitative results for all proteins.
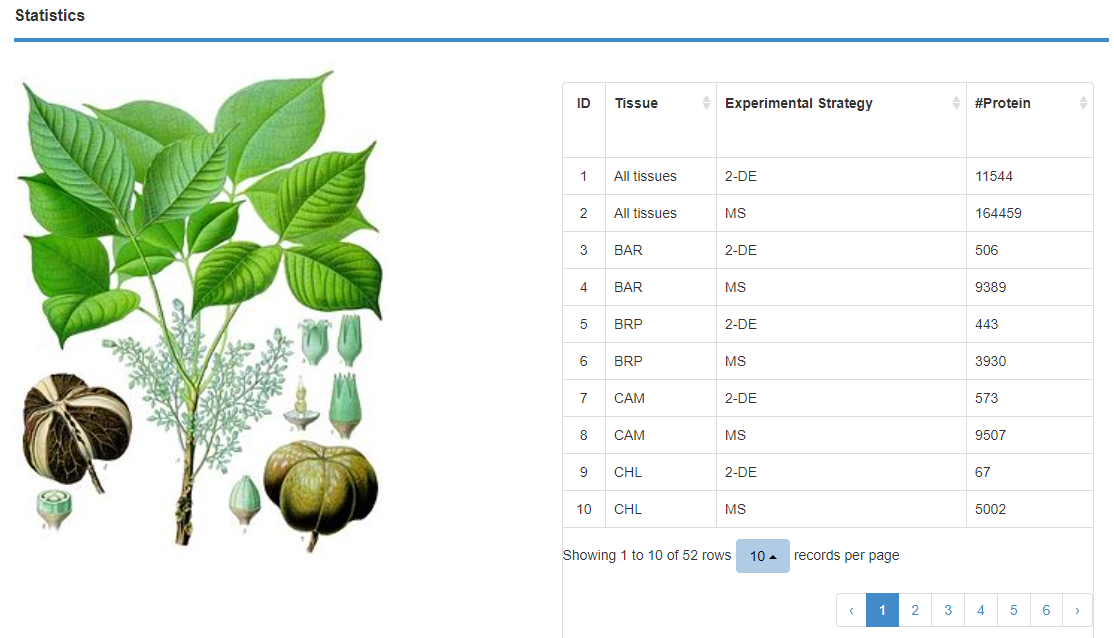
4. How can I check the number of identified proteins for each tissue?
In "Statistics", the number of individual tissues identified in the two experimental methods is shown. The number of proteins identified by different methods are shown separately.
5. How to guarantee data quality in HeBAtlas?
All experiments were performed with three or more biological replicates. For the two-dimensional gel electrophoresis experiments, three images were obtained for each tissue and the clearest gel image was selected as the download file. The 2DE map of each tissue was dug for protein spots and identified, and the identification was considered successful if more than two replicates were selected. The mass spectrometry onboard fractions of individual tissue samples were divided into 15 or 20 fractions, and the search library quantification results were taken as the average of the intensity values for each protein.